Popular Science: Immigrants - Where are they heading in the USA and Australia and how will it be in the future?
Research on immigrants gives us results which serve as a foundation for decisions on social or policy issues. One type of result is a prediction of the number of immigrants and their distribution within the target country. The aim of this article was to verify a method, which is based on a detailed analysis of the distribution of groups of immigrants, to predict where immigrants will go. In the observed countries, the USA and Australia, immigration is a key factor in population dynamics and the distribution of immigrants significantly affects the overall population structure. This is particularly significant on a regional scale, because immigrants are typically more concentrated than the original population. The share of the foreign-born population is 12.7% in the USA and 24.5% in Australia. The share of immigrants is getting bigger and bigger.
To test the suggested method, the authors of the article used data capturing the structure of immigrants in the regions according to their native country. The prediction was based on data from the year 2000. The results were compared with the reality in 2010. In spite of the short period (the first decade in the new millennium), the share of immigrants increased by 24% in the USA and 20% in Australia. This period showed changes in trends of the immigrant´s distribution in the target countries, thus an explanation of the future developments is so difficult. The new approach is giving better predictions.
The method is based on a simple hypothesis that more similar groups of immigrants come to the same regions. The similarity is primarily cultural, but economic, historical and institutional factors are also important. The similarity and relatedness of groups of immigrants might take a lot of forms and is therefore hard to specify. The assumption tested in the article comes from the opposite logic – the relatedness of groups is expressed by the appearance of immigrant groups together within the same regions. The authors tested if more immigrants flowed into regions in the USA and Australia from the group that has a higher spatial relatedness with groups concentrated in these regions at the beginning of the period. The results confirmed it.
The identified values of spatial relationships between pairs of immigrant groups clearly demonstrated parallels with other aspects of similarity. Emigrants from Jamaica and Trinidad and Tobago and the Chinese and Taiwanese have the most significant spatial relationship in the USA and furthermore people from the Caribbean and South America live in the same spatial units. In Australia the most significant spatial relationship is among groups of immigrants from Eastern Asia – from Malaysia and Singapore, Hong Kong and South Korea, and from Indonesia and Malaysia. Aboriginal people (born in the USA or Australia) have the most significant relationship with immigrants from Western countries, South Africa and then from Central and Eastern Europe. In other words, these groups are the most spatially dispersed in the USA and Australia. For example Mexicans, the most traditional and the largest community in the USA, are also highly dispersed in the USA. Historical processes are an important factor, as the authors demonstrate in a table that shows the migration waves to Australia. In the 40s and 50s immigrants from Eastern Europe came to Australia, in the 50s from the Netherlands, Germany, and then from Italy, Greece and Yugoslavia. In the 60s they came from Lebanon and Turkey, from the 70s from Asia and after the millennium from Africa. Immigrant waves and the most intensive arrivals affect the character of spatial distribution in the target countries.
It is obvious that assumptions about the relation between spatial distribution and other similarities cannot be useful everywhere. The authors mentioned that the relation might be weakened by institutional intervention or sudden historical events. There is a Vietnamese community in the USA, for example, whose distribution is significantly influenced by state interventions (a program for refugees during the Vietnam War) and people are running away from Central America (Salvador, Guatemala, Honduras) due to civil wars.
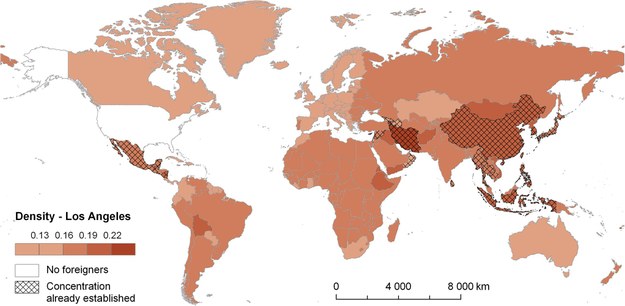
Examples of use were given at the end of article. It shows a map of the USA with the prediction of the future distribution of one immigrant group (from Cuba and Ukraine). The maps show Cubans concentrated in Florida and the prediction anticipates that the community will grow along the Atlantic seashore all the way to New York City. Ukrainians are concentrated in the northeast part of the USA and the community declines in the west of the USA. This east-west gradient will strengthen. The next maps show the immigrant flows to the cities (Miami Dade and Los Angeles). There are maps of the World showing countries with the most intensive immigrant streams to these regions.
Migrant trends are affected by many factors and prediction is very hard; it is also difficult to predict the influence of migration on changes in the size and structure of the target countries’ populations. The method in the article can help with better predictions.
Tomáš JANÍK
Document Actions